Introduction
Guides
- Up and Running
- Development Mode
- Configuration with exp.json
- Viewing Logs
- Debugging
- Assets
- Preloading & Caching Assets
- Icons
- Using Custom Fonts
- Routing & Navigation
- Push Notifications
- Genymotion
- exp Command-Line Interface
- Building Standalone Apps
- How Exponent Works
- Upgrading Exponent
- Using ClojureScript
- Using Firebase
Debugging
Using a Simulator / Emulator
There is no substitute to testing the performance and feel of your app on an actual device, but when it comes to debugging you might have an easier time using an emulator/simulator.
Apple refers to their emulator as a “Simulator” and Google refers to theirs as an “Emulator”.
iOS
For iOS the Simulator built into Xcode works great, you can install Xcode on the Mac App Store if you haven’t already.
Android
On Android we recommend the Genymotion emulator over the standard emulator — we have found it to be more feature complete, faster and easier to use.
Download Genymotion (free version) and follow the Genymotion installation guide. Once you’ve installed Genymotion, create a virtual device - we recommend a Nexus 5, the Android version is up to you. Start up the virtual device when it’s ready. If you run into any issues follow our Genymotion guide.
Debugging Javascript
You can debug Exponent apps using the Chrome debugger tools. Rather than running your app’s JavaScript on your phone, it will instead run it inside of a webworker in Chrome. You can then set breakpoints, inspect variables, execute code, etc, as you would when debugging a web app.
-
To ensure the best debugging experience, first change your host type in XDE to
LANorlocalhost. If you useTunnelwith debugging enabled, you are likely to experience so much latency that your app is unusable. While here, also ensure thatDevelopment Modeis checked.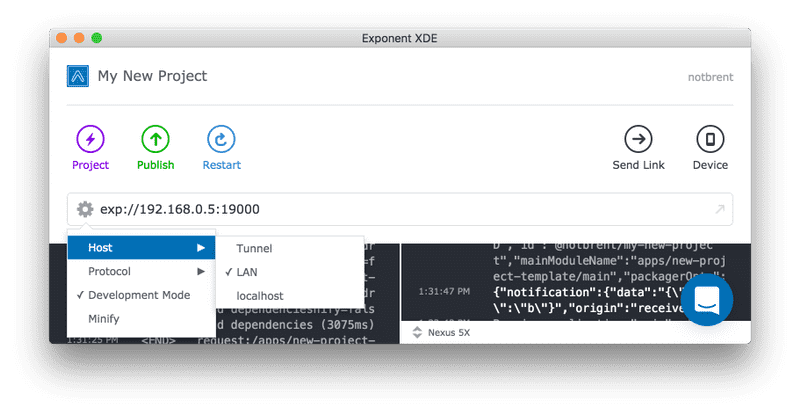
-
If you are using
LAN, make sure your device is on the same wifi network as your development machine. This may not work on some public networks.localhostwill not work for iOS unless you are in the simulator, and it only work on Android if your device is connected to your machine via usb. -
Open the app on your device, then shake the device a little bit (or hit Ctrl-Cmd-Z on a Mac in the emulator) to reveal the developer menu. Tap on
Debug JS Remotely. This should open up a Chrome tab with the URLhttp://localhost:19001/debugger-ui. From there, you can set breakpoints and interact through the JavaScript console. Shake the device and stop Chrome debugging when you’re done. -
Line numbers for
console.logstatements don’t work by default when using Chrome debugging. To get correct line numbers open up the Chrome Dev Tools settings, go to the “Blackboxing” tab, make sure that “Blackbox content scripts” is checked, and addexponent/src/Logs.jsas a pattern with “Blackbox” selected.

Troubleshooting localhost debugging
When you open a project in XDE and when you press Open on Android, XDE will automatically tell your device to forward localhost:19000 and 19001 to your development machine, as long as your device is plugged in or emulator is running. If you are using localhost for debugging and it isn’t working, close the app and open it up again using Open on Android. Alternatively, you can manually forward the ports using the following command if you have the Android developer tools installed: adb reverse tcp:19000 tcp:19000 - adb reverse tcp:19001 tcp:19001
Source maps and async functions
Source maps and async functions aren’t 100% reliable. React Native doesn’t play well with Chrome’s source mapping in every case, so if you want to make sure you’re breakpointing in the correct place, you should use the debugger call directly from your code.
Debugging HTTP
To debug your app’s HTTP requests you should use a proxy. The following options will all work:
- Charles Proxy ($50 USD, our preferred tool)
- mitmproxy
- Fiddler
On Android, the Proxy Settings app is helpful for switch between debug and non-debug mode. Unfortunately it doesn’t work with Android M yet.
There is future work to get network requests showing up in Chrome DevTools.
Hot Reloading and Live Reloading
Hot Module Reloading is a quick way to reload changes without losing your state in the screen or navigation stack. To enable, just shake your device (or hit Ctrl-Cmd-Z on a Mac in the emulator) and tap the “Enable Hot Reloading” item. Whereas Live Reload will reload the entire JS context, Hot Module Reloading will make your debug cycles even faster. However, make sure you don’t have both options turned on, as that is unsupported behavior.
Other Debugging Tips
Dotan Nahum outlined in his “Debugging React Native Applications” Medium post other useful tools such as spying on bridge messages and JSEventLoopWatchdog.
© Copyright 2017, Exponent. Created using Gatsby.